
Avoiding The Bubble Blues: Analyzing 5 Overseas Property Markets
Real estate bubbles are as fun as they are dangerous. You can make huge profits… or you can lose it all.
The trick is to know when to ride the bubble up a little further and when to get out.
Property bubbles are popping across the globe.
In the United States, real estate prices are dropping in 98 of the 148 major U.S. markets. Prudent investors are liquidating their U.S. assets and buying into safe haven markets to ride out the coming reset.
But you don’t want to buy into an overseas property bubble that’s just about to burst. To avoid this, you need to be able to recognize a bubble when you see one.
What’s A Bubble?
Bubbles are more than just hot real estate markets. They occur when assets are mispriced due to increases in demand, limitations on supply, cheap credit, or emotional buying.
In a bubble, sanity leaves the market and the fundamentals no longer stack up, but prices keep rising anyway.
There are all sorts of voodoo economic theories that speculators use to identify if a property bubble exists and what stage it’s in. None of them really work…
Seasoned property investors use four ratios to evaluate how healthy a property market is.
These ratios won’t predict when a property bubble will burst, but being able to recognize when one is occurring allows you to reduce your risk, maximize your profits, and be the first into fresh markets.
Let’s review these simple ratios and examine a country that shows extreme indicators of being in a property bubble and then evaluate which countries aren’t likely to be part of the coming global property collapse…
One country scoring badly in one ratio doesn’t mean a bubble is occurring, but two or three bad ratios is something to be concerned about.
Ratio 1: House Price-To-Rent Ratio Over Time
This ratio tracks how much rents increase when house prices increase in a country. When property prices soar but rents don’t increase in step, this is an indicator of trouble. It indicates an unsustainable long-term market.
But you can’t just look at the house price-to-rent ratio in isolation. A low house price-to-rent ratio doesn’t mean a bubble is happening. More mature property markets simply return a lower ROI.
To spot a bubble, the price-to-rent ratio must be worsening over time. Because investors agree that 2014 was the year when most markets had fully recovered from the 2008 real estate collapse, in this review I’m looking at 2015 to 2021.
Taking 2015 as the benchmark for our housing markets, this is our 100% level.
If prices and rents rose at the same pace, the ratio would still be 100% today. Let’s see how the price-to-rent ratio stood up over time for five countries…
New Zealand
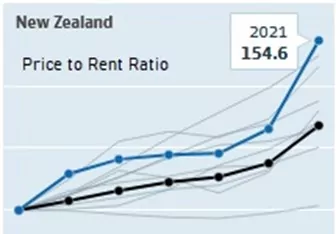
In the New Zealand chart above, the black line represents the Organization for Economic Co-Operation and Development of Economic (OECD) average.
According to the OECD, New Zealand’s house price-to-rent ratio has shot up since 2015, with the rents staying relatively stagnant. A 54% increase in the price-to-rent ratio is a decrease in the relative return on investment.
This is a large deterioration in the ratio and a bad sign for New Zealand’s property market.
Spain
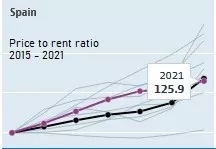
In Spain, over the 6-year period, the price-to-rent ratio has increased by 25% to 125% of the 2015 ratio. This is somewhat concerning but not conclusively a bubble situation.
Investors into Spain need to watch the rental returns achievable in any regional market they are considering buying into, but value can still be had in Spain if you do your research.
Colombia
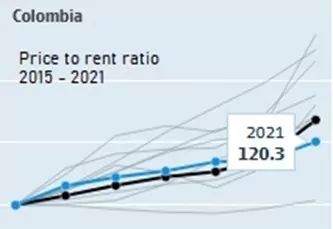 Colombia’s price-to-rent ratio is a little better than Spain’s and less than the OECD average, having only lost 20% in relative terms over six years. This is within the normal margin of decrease in relative returns for maturing markets.
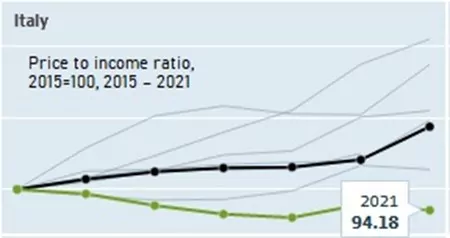
Italy
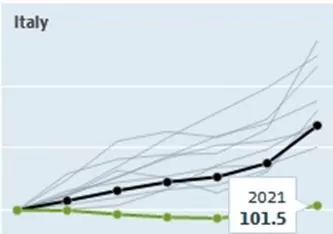 Italy’s price-to-rent ratio has only increased 1.5% in the six years under review. Italy has held its own nearly perfectly, and any increases in property prices have been nearly fully matched by corresponding rent increases. There is no sign of any bubble here.
Brazil
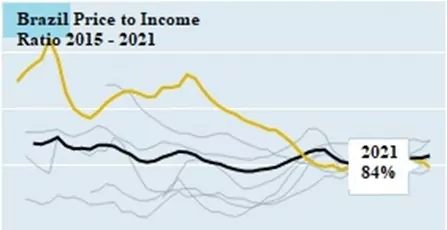
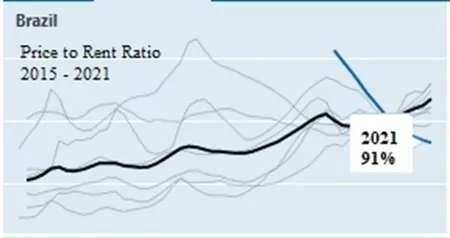 Brazil’s price-to-rent ratio is the best by far. Rental returns have increased in relative terms compared to house prices, meaning the rental market is better now for investors than it was in 2015.
Brazil exhibits “anti-bubble” characteristics… very interesting given the global real estate climate.
If you’d like to hear about beach bungalow opportunities in Northern Brazil, click here to talk to our in-house property advisors.
Ratio 2: House Price-To-Income Ratio Over Time
Analyzing how fast house prices are increasing relative to how fast local incomes are increasing is another strong indicator of whether buyers will be able to pay their mortgage over the long term.
Ballooning price-to-income ratios are another indicator of trouble.
If house prices skyrocket and wages stay the same, local buyers will be forced out of the market. Once again, I’m considering the relative changes in these ratios over time and not just looking at a snapshot of a ratio.
I’m taking the 2015 ratio as my base level, exhibited here as 100%. The black line is the OECD average.
New Zealand
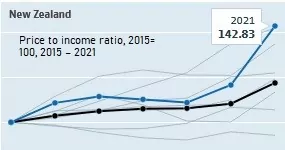 New Zealand’s price-to-income ratio has spiked to 142% from its 2015 levels, meaning house prices are rising far faster than incomes are. This is a worrying sign, as more of an investor’s income is required to cover the cost of a new mortgage, and bank lending restrictions can price buyers out of the market.
Spain
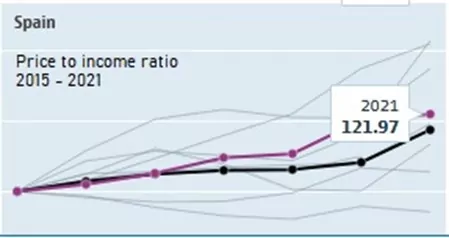 Spain once again is standing between a maturing market and a speculative bubble. With its price-to-income ratio increasing to 121% since 2015, houses have become somewhat more unaffordable for Spanish homebuyers but not alarmingly so, at least for the moment.
Colombia
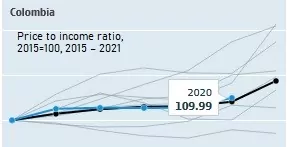 Colombia experienced modest increases in the price-to-income ratio over the five years from 2015 to 2020 (2021 figures not available yet).
A 10% increase in the ratio in a maturing market isn’t unexpected and is less than the OECD average. This metric suggests Colombia isn’t under bubble pressures.
Italy
 Italy exhibits improving price-to-income ratios, meaning property is becoming more affordable for Italian homebuyers. This will gently boost the market in the medium term and will help avoid any bubble issues other countries are currently fighting.
Brazil
 Brazil once again wins the contrarian investors trophy by showing a significant jump in affordability for local Brazilian homebuyers. This is a healthy sign for the longevity of the current buoyant market. Brazil’s property market took longer to recover from the 2008 collapse than most, and incomes have strengthened over the period.
Again, Brazil shows no signs of a bubble…
Ratio 3: Real House Prices
The inflation-adjusted housing price ratio gives you an idea of whether the housing price increase is growing faster than inflation and by how much.
Unbridled appreciation in real terms isn’t sustainable and another indicator of trouble.
Ratio 3 is real house price changes over time. As I’m taking 2015 as my benchmark year, I take the nominal percentage increase in prices per year and deduct the inflation the country experienced. This shows the real house price changes.
All investors like to see healthy capital appreciation, but when too much occurs too quickly, it’s a strong sign of a bubble or a market that has reached its peak.
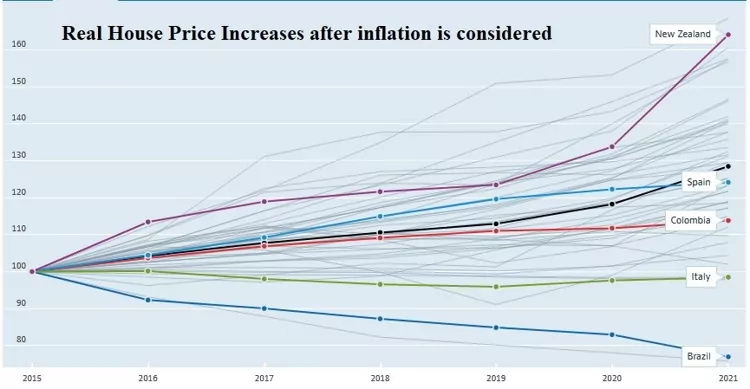
New Zealand
New Zealand is sporting a 164% ratio, which is a 64% increase in real property prices over the 6-year period. This equates to over 10% per year capital appreciation after inflation, which is a very strong increase.
Gains like this are unsustainable in the long term.
Spain
Spain has a more modest 124% ratio, which represents a real price increase of 24% and much closer to what we’d expect from a mature property market, even in boom times.
Spain once again remains within the bounds of safe investing.
Talk to our recommended Spanish realtor about all aspects of investing in Spanish property here.
Colombia
Colombia’s 113% ratio proves a 13% increase in real house prices. This is indicative of a market that hasn’t appreciated much in real terms over the last six years.
Given the great value available in Colombia, this could indicate a delayed property boom or a sluggish market affected by a weak currency and the pandemic lockdowns, but it certainly refutes the idea of a property bubble in Colombia.
Italy
Italy’s 98% ratio shows a 2% decrease in real property value after inflation, which isn’t surprising if you follow Italy’s politics or economy.
Italy has shown little signs of a property boom and no signs of a property price bubble. Even though it’s safe from a bubble, it isn’t necessarily a good long-term capital appreciation play.
Brazil
Brazil’s somewhat surprising 77% ratio means that property in Brazil has appreciated at a lesser rate than inflation and currency devaluations have eroded its value.
Property in Brazil is relatively cheaper now than it was seven years ago. However, when the Brazilian real recovers in value (I’ll be covering the pending rebound in value of the real in Overseas Property Alert next month) and inflation falls back into normal territory, Brazilian property values should soar.
Ratio 4: Household Debt As A Percentage Of GDP
Imbalances in the economy, excess lending, and too much capital in the markets are indicators of trouble.
Household debt-to-GDP ratios reflect the effect of cheap financing and weak economic growth on the market. The higher the number, the more exposed borrowers are to increases in interest rates.
Artificially low interest rates are huge boosters of property bubbles, and when the unnaturally low interest rates go up, it can stymie the property market or cause house prices to collapse.
The crossing of consumer debt past the 100% of GDP mark is a sign that lending is unsustainable. Higher debt means more mortgage defaults if the economy slows or the interest rates rise.
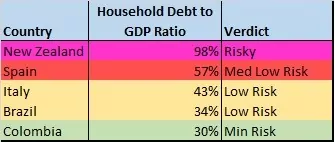 New Zealand once again is right on the bubble, with 98% household debt to GDP ratio.
Spain is moderately comfortable with a 57% debt to GDP ratio. Italy is surprisingly healthy with its 43%. Brazil shows very low household debt at 34%, and Colombia impresses us all with its miniscule 30% ratio, a pittance compared to all western economies.
Go here for more information about investment in Colombia’s real estate market.
The Verdict
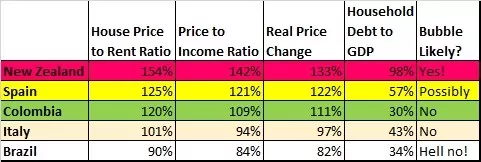 New Zealand exhibits all the signs of a property bubble in abundance. That’s our bubble benchmark.
Spain is still a large, healthy market… but some areas in Spain are in bubble territory. Spain’s market is a little different to the others in this review as foreign buyers make up an unusually large 12% to 19% of the total market, depending on the region you choose. This means the price-to-income ratio and the household debt-to-GDP ratio are less impactful, as foreigners aren’t constrained by local wage increases or debt levels.
If you want to invest in Spain, make sure to analyze the fundamentals and that you’re getting value in your investment.
Colombia is a maturing market with no signs of a bubble. It has low household debt. This means the Colombia real estate market is safe from bubbles in the medium term and offers an attractive investment market.
Italy, with its economic and political woes, is safe from bubbles at any stage in the near future, but it’s also safe from strong capital appreciation.
Only Brazil, with its large and diverse economy, newly elected pro-business president, and depressed real estate prices due to a weak currency, shows no signs of any bubble in the property market but promises strong rental and capital appreciation potential in the short and medium term.
Brazil is my #1 choice to ride out the deflating global property bubble.
Go here to find out more about Brazil property.
Con Murphy
Editor, Overseas Property Alert